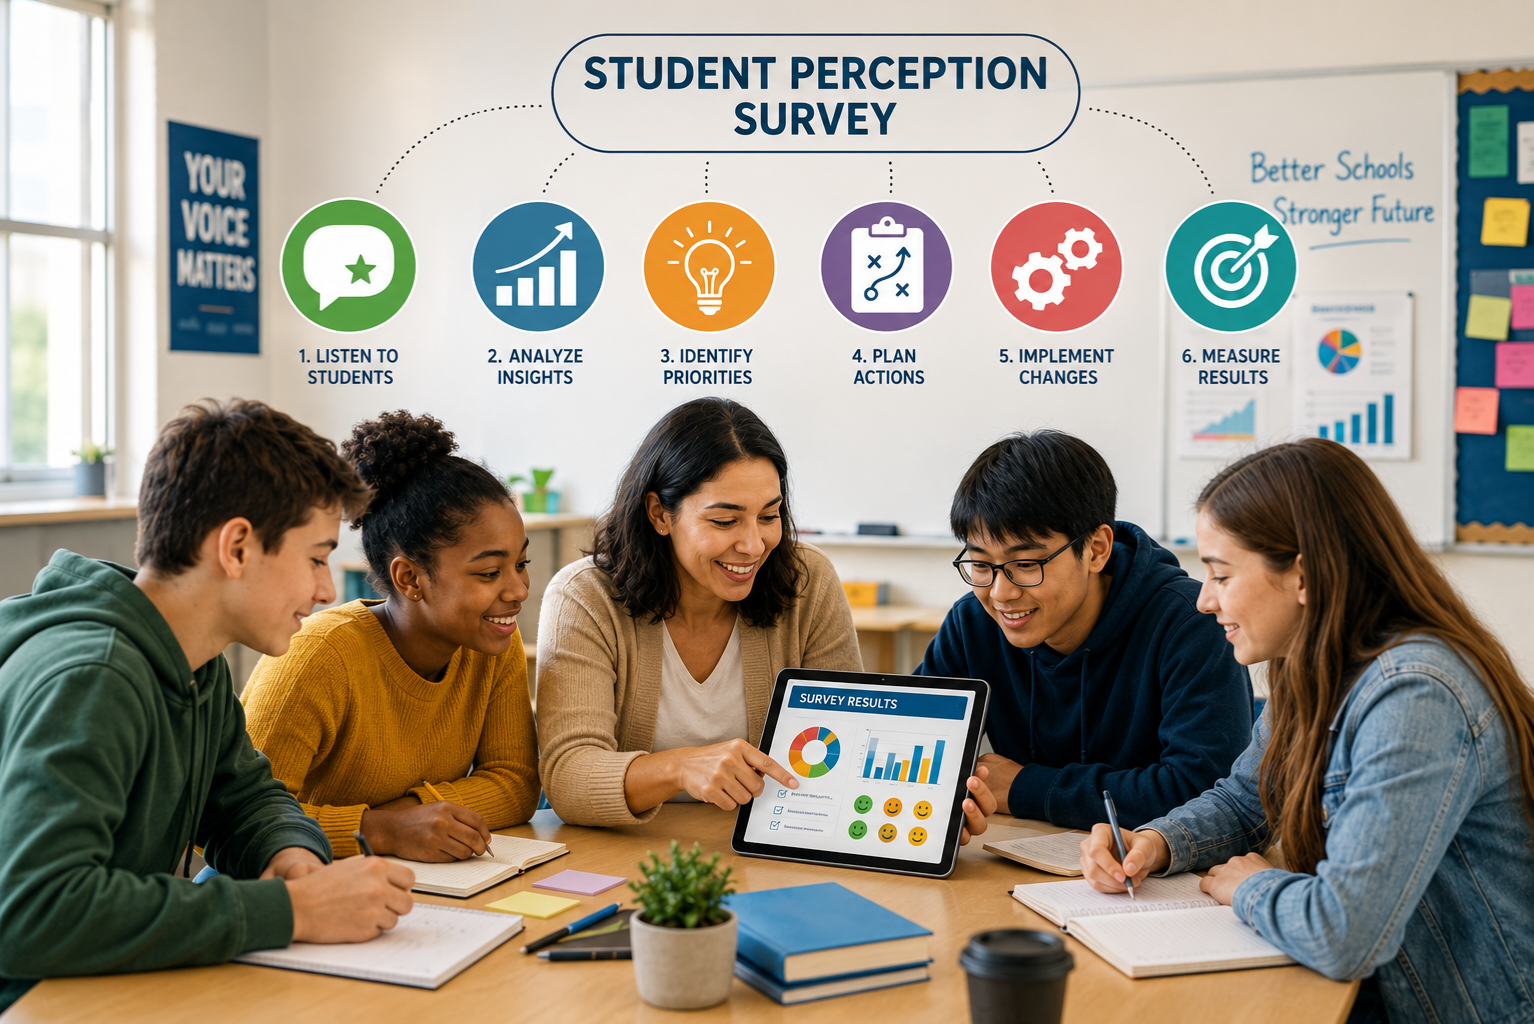
Schools that genuinely want to grow cannot afford to guess what their students are thinking. A student perception survey gives educators direct access to the honest, unfiltered opinions of the people sitting in classrooms every single day. These are not abstract data points — they are real signals about what is working, what is falling flat, and where the learning environment needs serious attention. When schools commit to running a well-designed student perception survey consistently, the results become one of the most actionable intelligence sources available to administrators and teachers alike. This article covers everything from why these surveys matter to how to build them, analyze them, and turn the findings into meaningful change that students can actually feel.
Understanding student voice has shifted from a nice-to-have practice to a professional expectation in high-performing educational institutions worldwide. Districts that have embedded regular feedback cycles report stronger teacher-student relationships, improved academic engagement, and lower absenteeism rates compared to those relying solely on test scores and attendance data. A thoughtfully constructed student perception survey sits at the center of that feedback cycle, giving every learner a structured opportunity to contribute their perspective to the ongoing improvement of their own education.
Why Surveys Actually Matter
The most common mistake schools make is treating student feedback as a checkbox activity rather than a genuine improvement tool. A student perception survey only delivers value when the institution collecting the data is genuinely prepared to examine what comes back — including uncomfortable findings. Students are perceptive in ways that formal observation tools often miss. They notice patterns in how lessons are paced, whether their teacher seems engaged or exhausted, and whether the classroom climate feels psychologically safe enough for them to take academic risks. No external evaluator captures that texture the way a thoughtful survey does.
Research consistently shows that students whose opinions are actively solicited and visibly acted upon report significantly higher levels of school belonging and motivation. The act of asking is itself a message — it communicates that the institution views students as partners rather than passive recipients of education. When follow-through accompanies the asking, trust compounds over time and future survey responses become more honest and detailed. That honesty is precisely what makes a student perception survey worth the investment of time and design effort.
Designing Effective Survey Questions
Question quality determines the usefulness of every response a student perception survey generates. Vague questions produce vague answers, and leading questions produce responses that reflect what students think you want to hear rather than what they genuinely experience. The most effective survey questions are specific, neutral in framing, and tied directly to observable classroom behaviors or school practices. Instead of asking whether a teacher is good, asking whether students feel comfortable asking questions during class produces a more actionable and measurable response.
Mixing question formats strengthens any student perception survey considerably. Likert scale questions capture frequency and agreement patterns across large groups efficiently, while open-ended prompts give students space to explain nuance that a rating scale cannot accommodate. Including at least three to four open-ended questions per survey ensures that quantitative trends are always accompanied by qualitative context. The combination allows analysis teams to move from identifying that a problem exists to understanding why it exists and what students suggest should change.
Age-Appropriate Survey Formats
A student perception survey designed for high school seniors will not work for third graders, and attempting to use one template across all grade levels produces unreliable data. Younger students need shorter surveys with simpler language, visual rating scales like emoji-based responses or smiley face continuums, and read-aloud administration to ensure comprehension. Asking a nine-year-old to rate whether their teacher provides differentiated instruction using academic vocabulary produces confusion rather than insight.
Middle school students occupy a particularly interesting position in the survey design conversation. They are old enough to understand nuanced questions but developmentally primed to give socially influenced answers, particularly when surveys are completed in groups. Anonymous digital formats tend to produce more honest responses from this age group than paper surveys completed at desks where peers can see each other’s answers. You can explore more about how different educational models handle student voice through resources like MasteryConnect’s complete guide, which outlines how data-driven platforms support learner feedback systems at scale.
Anonymity and Honest Responses
Anonymity is not just a procedural detail — it is the structural condition that makes a student perception survey genuinely trustworthy. When students believe their responses can be traced back to them, they self-censor in predictable ways, avoiding criticism of teachers they like personally and softening negative feedback about school conditions they find genuinely problematic. The result is data that reflects social calculation rather than authentic perception, which defeats the entire purpose of collecting feedback in the first place.
Establishing and communicating clear anonymity protocols before survey administration changes response patterns measurably. Students need to hear explicitly — not just read in fine print — that their individual answers will never be shared with their teachers, that results will only be reported in aggregate, and that no effort will be made to identify individual respondents based on open-ended comments. Repeating these assurances at the start of every survey cycle, rather than only during the first administration, maintains the trust that produces honest data over time.
Timing Your Survey Cycles
When a student perception survey is administered matters almost as much as how it is designed. Surveys conducted during the first two weeks of a school year produce responses shaped more by first impressions and novelty than by genuine experience. Similarly, surveys given during the final week before a major assessment or during a high-stress period capture anxiety-influenced perceptions that may not reflect the baseline classroom experience accurately. The most useful data comes from surveys administered during stable instructional periods when students have had enough time to form genuine impressions but have not yet hit the fatigue of end-of-term pressure.
Multiple survey administrations per year produce richer longitudinal data than a single annual snapshot. Running a student perception survey in October and again in February, for example, captures how perceptions shift as the school year develops, which teachers and practices improve over time, and where early-year concerns either resolve or deepen. Comparing results across cycles is one of the most powerful ways to demonstrate growth and identify persistent issues that require more substantial intervention than individual teachers can address on their own.
Analyzing Results with Depth
Data from a student perception survey becomes genuinely useful only after rigorous, nuanced analysis that goes beyond calculating average scores. Disaggregating results by grade level, demographic group, or subject area often reveals disparities that aggregate numbers mask entirely. A school-wide average satisfaction score of 4.2 out of 5 might obscure the fact that students in one particular grade report significantly lower feelings of belonging, or that students from one demographic subgroup consistently rate classroom safety lower than their peers. Surface-level analysis misses these patterns entirely.
According to Harvard’s Center for Education Policy Research, schools that disaggregate student feedback data by subgroup and use those findings to inform professional development decisions show measurably stronger equity outcomes over time. This kind of systemic use of survey data requires analytical capacity that not every school possesses internally, which is why training data leads or partnering with external analysis support is a worthwhile investment. The goal is always to move from what the numbers say to why those numbers exist and what specific actions follow from that understanding.
Teacher Growth Through Feedback
Connecting a student perception survey to teacher professional development is one of the highest-leverage applications of feedback data available to school leaders. When teachers receive aggregated results from their own students — presented without judgment and framed as growth opportunities — most respond constructively, using the data to refine specific practices that students flagged as confusing, intimidating, or disengaging. This process works best when survey results are introduced through coaching conversations rather than administrative evaluations, preserving the developmental rather than punitive framing.
The distinction between using survey data for professional learning versus using it for formal teacher evaluation is important to preserve deliberately. When teachers believe that student perception data feeds directly into their performance ratings, they sometimes attempt to influence survey responses, which corrupts the data and destroys the trust that makes honest feedback possible. Separating these two uses of survey information — maintaining student perception as a growth tool and keeping formal evaluation processes on a separate track — protects the integrity of both systems simultaneously.
Sharing Results Transparently
Closing the feedback loop is where most schools fall short in their student perception survey process. Students who complete a survey and never hear anything about what happened with their responses gradually lose motivation to participate honestly in future cycles. Transparency about what the data showed and what decisions followed from it is not just good practice — it is the mechanism through which survey participation becomes meaningful rather than performative for students.
Sharing results does not require detailed statistical presentations. A brief classroom conversation where a teacher says something like “you told us you wanted more time to ask questions, so we are going to try starting lessons ten minutes earlier to build that in” accomplishes the feedback loop effectively without bureaucratic complexity. School-wide findings can be shared through student assemblies, newsletter summaries, or student government presentations. The specific format matters far less than the consistency of the practice — students need to see that their voices produced something real.
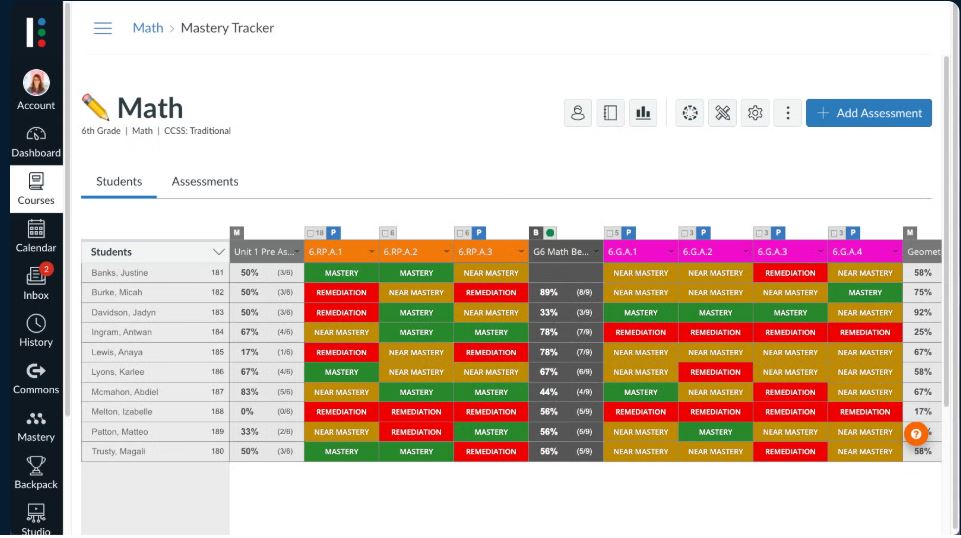
Digital Tools for Surveys
The platform through which a student perception survey is delivered shapes both participation rates and data quality in meaningful ways. Paper surveys administered during class guarantee near-complete participation but create manual data entry burden and delay analysis timelines significantly. Digital platforms like Google Forms, SurveyMonkey, or purpose-built educational survey tools streamline collection, automatically aggregate results, and generate visualizations that accelerate the analysis phase considerably.
Purpose-built educational survey platforms often include features specifically designed for the student feedback context — conditional branching that adjusts questions based on earlier responses, integration with student information systems for demographic disaggregation, and built-in anonymity protocols that are more robust than generic survey tools offer. For schools running large-scale or district-wide student perception survey programs, purpose-built tools justify their cost through the time they save in analysis and reporting, even when free alternatives technically accomplish the basic data collection function.
District-Level Implementation Strategies
Scaling a student perception survey from individual classrooms to an entire district requires coordination that classroom-level implementation does not. Districts need shared question banks that allow comparison across schools while still leaving room for school-specific additions that capture local context. Without a shared core set of questions, district leaders cannot meaningfully compare results or identify patterns that transcend individual school performance.
Successful district-level implementations typically designate a central data coordinator whose role includes maintaining survey infrastructure, supporting schools in analyzing their results, and producing district-wide summary reports that inform strategic planning. This role prevents the common failure mode where survey data sits in a dashboard that nobody has the time or capacity to interpret meaningfully. Investing in that analytical capacity at the district level multiplies the return on every individual student perception survey cycle conducted across member schools.
Cultural and Linguistic Considerations
A student perception survey that asks questions in only one language immediately excludes the perspectives of students for whom that language is not their primary mode of communication. Schools serving multilingual populations need translated versions of their surveys that capture the same constructs accurately rather than just converting words literally. Professional translation that accounts for cultural context — rather than machine translation that can introduce subtle distortions — protects the validity of responses from linguistically diverse students.
Beyond language, cultural norms around authority, criticism, and deference to teachers shape how students from different backgrounds respond to survey questions. In some cultural contexts, criticizing a teacher directly — even anonymously — carries deeply conditioned discomfort that suppresses honest negative feedback regardless of how the survey is framed. Building cultural competency into survey design and administration means acknowledging these dynamics explicitly, perhaps through culturally informed facilitation that normalizes the practice of constructive feedback as a form of respect rather than disrespect.
Using Data for Equity Goals
A well-executed student perception survey is one of the few tools available to schools that simultaneously measures equity conditions and gives marginalized students a formal channel to name their experience. When data consistently shows that students from particular groups feel less safe, less heard, or less supported than their peers, that pattern represents an equity gap with evidence strong enough to justify targeted intervention. Schools committed to equity work increasingly treat survey data not as supplementary but as central to their improvement planning.
Equity-focused analysis of student perception data requires asking harder questions than overall averages prompt. It means asking which students feel seen in the curriculum, which students feel their cultural backgrounds are respected in the classroom, and which students experience disciplinary practices as fair. These are uncomfortable questions to surface, and the data that answers them sometimes produces findings that challenge deeply held assumptions about school culture. That discomfort is precisely why the process matters — equity gaps do not close when they remain invisible.
Parent Engagement with Findings
Parents and guardians are natural stakeholders in what a student perception survey reveals about school climate, teaching quality, and the overall learning environment their children inhabit daily. Sharing high-level survey findings with parent communities through school newsletters, parent-teacher organization meetings, or dedicated communication channels builds the kind of transparency that strengthens school-family relationships. Parents who see that the school actively seeks and responds to student feedback tend to view the institution as more trustworthy and collaborative.
The key is presenting findings in accessible language that invites dialogue rather than defensive reaction. Framing survey results as “here is what we learned and here is what we are doing about it” positions the data as evidence of institutional responsiveness rather than institutional failure. Parents generally respond positively to that framing, and their reinforcement of the school’s feedback culture at home — encouraging their children to respond honestly in future surveys — contributes to the participation quality that makes the data valuable in the first place.
Longitudinal Tracking Over Years
Running the same core student perception survey questions across multiple school years creates a longitudinal dataset that reveals trends invisible to any single-year snapshot. Schools that have maintained consistent survey instruments over five or more years possess a genuinely rare asset — evidence of how school culture, teaching quality, and student experience have shifted in response to deliberate improvement efforts. This kind of longitudinal evidence is compelling to school boards, accreditation bodies, and grant funders in ways that single-year data simply cannot match.
Maintaining longitudinal integrity requires resisting the temptation to substantially revise survey questions every year in response to emerging priorities. While some evolution is necessary and healthy, changing core questions breaks the comparability that makes year-over-year tracking possible. Designating a set of anchor questions that remain constant across years — while allowing a rotating set of supplementary questions to address current priorities — preserves both longitudinal value and the flexibility to capture timely concerns as they emerge.
Student Involvement in Design
Involving students in the actual design of a student perception survey produces instruments that ask better questions and generates stronger student investment in the process. When students help write survey items, they naturally use language that resonates with their peers, avoid the institutional jargon that sometimes alienates respondents, and identify dimensions of school experience that adults designing surveys from the outside would never think to ask about. Student design teams, particularly at the secondary level, can meaningfully improve the validity and relevance of survey instruments.
This participatory approach also serves an important civic education function. Students who participate in designing a student perception survey learn that data collection is a tool for advocacy, that their experiences are worth documenting systematically, and that institutions can be influenced through structured evidence rather than only through informal complaint. These lessons extend well beyond the immediate survey context, contributing to the broader development of students who understand how organizations work and how to influence them constructively.
Acting on Every Cycle
The most important thing any school can do with a student perception survey is act on it — consistently, visibly, and with enough specificity that students recognize their feedback in the changes that follow. Generic responses like “we are committed to continuous improvement” do not close the feedback loop. Specific responses like “you told us homework load was interfering with sleep, so we have introduced a no-homework weekend policy starting next month” demonstrate that survey data produces real decisions rather than symbolic gestures.
Building action planning into the formal survey calendar — scheduling dedicated time for teachers and administrators to review results and develop response plans before the next survey cycle begins — prevents the common failure mode where findings are acknowledged but never translated into change. Schools that treat action planning as an integral step in the survey process, rather than an optional follow-up, produce measurable improvements in both student experience and future survey participation rates. A student perception survey is ultimately only as powerful as the institutional will to change in response to what it reveals.
FAQs About Student Perception Surveys
What is a student perception survey and why does it matter? A student perception survey is a structured feedback tool that captures how students experience their classroom environment, teaching quality, and school culture. It matters because it surfaces insights that observation tools and test data cannot capture, giving educators a direct line to what students genuinely think.
How often should a student perception survey be conducted? Most schools benefit from running a student perception survey at least twice per year — once mid-fall and once mid-winter — to capture how perceptions evolve across the school year and give teachers actionable feedback while there is still time to adjust.
Should student perception survey results be used in teacher evaluations? Most education researchers recommend keeping student perception survey data separate from formal teacher evaluation processes. Using it for growth-focused professional development preserves the honest response quality that makes the data valuable in the first place.
How do you encourage honest responses on a student perception survey? Clear communication about anonymity protocols, delivered verbally before each administration, produces the most honest responses. Students who genuinely believe their individual answers cannot be traced back to them report significantly different — and more candid — perceptions than those who doubt the anonymity guarantee.What should schools do after analyzing student perception survey results? Schools should develop specific, visible action plans tied directly to survey findings, communicate those plans to students, and track whether the changes implemented actually shift perceptions in subsequent survey cycles.